breville barista express machine

For about a year I have been making espresso based drinks at home. Coffee, and coffee based drinks, is not something I got interested in until after Covid but my appreciation of it has grown over the years to the point where I found it was better financially to make it at home than buy it daily from a local shop. In this post I am going to discuss the equipment and accessories I have found success with and why you may or may not want to do the same at home. I am not going to get into how to use this equipment as there is a lot of content on YouTube to choose from. One of the best is James Hoffman.

The drinks I make are mostly mochas and occasional lattes, both hot and iced.

Major Equipment

Cutting right to the chase, I went with a Breville Barista Express. I did a lot of research at the time and I wanted to be sure that if I didn’t like making espresso at home, it wasn’t because I selected bad equipment. The Breville seemed to be well regarded for a home machine that had a built in grinder. It is the right size, I liked the look of it and it is capable of making excellent espresso based drinks. Having the built in grinder was a plus for me because I have limited space available.

Pros of this model include:

  • built in grinder works well
  • easy to fill hopper and water tank
  • easy to empty water tray
  • brew head and steam system heat up quickly
  • programmable volumetric controls
  • double and single shot baskets as well as pressurized baskets for pre-ground coffee (though I don’t recommend using pre-ground)
  • includes accessories like tamper and milk jug

Cons of this model include:

  • the steam wand is not cool touch
  • being a single boiler means the steam is slow

Bottom line, this is a great machine for a beginner or at home barista that wants to get everything covered with a single purchase. You can technically get just this, your choice of beans and get started. That said, if I were to start over I would consider a dual boiler machine, even if that means an external grinder, just so that steam performance is better.

Accessories

While the Breville includes everything you really need to get started, I wanted to further improve my enjoyment of the process. Here I’ll go through the accessories I use.

Milk Pitcher

Having a milk pitcher that includes measurements right inside the pitcher is very helpful. The pitcher included with the Breville is unmarked so you are left guessing how much milk to use. There are many copy cat pitchers on Amazon, but I am using this “Adorever” one.

Thermometer

Getting a consistent milk temperature is hard to do without a thermometer. This one with a clip and little zones telling you the ideal temperatures is easy to use and works perfectly. Clip it to the side of the milk pitcher while frothing the milk.

Funnel

I find using a funnel an absolute must if you want to keep your area clean. Even without the funnel you’re going to make a small mess but the funnel makes it much easier to keep the grounds in the basket. I selected this funnel because it fits the Breville portafilter and the grinder spout perfect. While I am linking to the stainless steel version it is no longer the only version available. The aluminum one will work just as well and costs less, the important part is the funnel makes it much easier to get the grounds from the grinder and into the basket.

Puck Screen

Venturing into “less necessary” territory we have a puck screen. The linked to item is designed to fit the size of portafilter the Breville uses, at 54mm. A puck screen goes on top of the tamped coffee grounds and primarily works to keep the water screen of the group head clean longer. In my opinion, it has rather debatable benefits beyond that.

WDT Tool

The Weiss Distribution Technique tool is another item that has debatable benefits but I do find it makes it a lot easier to tamp the grounds so that they are more even. I use the tool to help ensure the grounds are spread more evenly in the basket though you may find a leveling distribution tool works better.

Basket Removal Tool

I have found that removing the basket in the Breville portafilter to be a bit on the difficult side. This little tool makes it much easier to remove the basket for cleaning.

Scale

Having a scale is a must for getting your espresso shot setup properly. Without a scale you are really flying blind and hoping for the best. Each brand and type of bean will require you to setup the machine just a bit differently to ensure you are getting the right flavor from the coffee. Using a scale helps ensure all your ratios are correct. This link is for the scale I have but any scale that has a fast response time and a built in timer will work just as well.

Bottle Pourers

If you don’t want to use a pump for flavors you might consider some pourers to make it all easier. This pack includes a good number of pourers that work well with most syrup bottles. For syrups and sauces, I use mostly Monin but Torani can be easier to find in stores.

Measuring Shot Glass

I use two different, small measuring cups during my brew process. The first one is a 3oz shot glass with measuring lines. This shot glass allows me to measure out syrups and sauces with ease to ensure I get just the right ratios. For the espresso shot I use a small cup that includes measuring lines that is still wide enough to catch the output from the portafilter spout. This helps me see what the liquid output is.

Finishing Up

Ok, that was actually more than I thought it would be. Again, not everything here is necessary but I find these products help make the process of brewing espresso easier and more enjoyable!

Disclaimer: This post contains Amazon Affiliate links. If you purchase something from Amazon using a link I provided I will likely receive a commission for that sale. This helps support the site!

One of the more frustrating changes in the past year was the Chamberlain group removing access to their APIs for third parties. This meant I could no longer see the status of my garage door openers or control them using Home Assistant, which is my preferred method for doing home automation. In this post, I am going to discuss how I got around this using a device called “ratgdo.”

Ratgdo is a micro-controller based device created by Paul Wieland to control “virtually any residential Chamberlain or Liftmaster manufactured garage door opener and also offers basic support for other brands which use dry contacts to control the door.” The device is a custom made PCB that connects to the terminals on the garage door opener and, using various protocols like esphome, Apple Homekit, MQTT and more, allow you to see the status of the door and control it.

Setting up the device was quite simple. I started by connecting it to my computer using the included USB cable and visited the firmware installation page. Since I am using Home Assistant I opted for the esphome method. After selecting my board I clicked the connect button and it flashed the device with the proper firmware. After that, Home Assistant saw the new esphome device and offered to set it up. From there I setup the buttons and integrations I wanted and I was done.

If you are looking for a way to add some smarts to your garage door opener the ratgdo device is a fantastic way to do it and I highly recommend it. The prebuilt PCB costs about $45 (as of this writing) but is a quick and easy way to get going without a lot of fuss.

After installing a Sony XAV-AX6000 head unit and getting everything setup I decided I want to go the next step and add a subwoofer. Not because the Sony ruined the sound by any means, it just gave me the itch to get even better bass. I don’t really want to give up trunk space so I decide to try the JBL BassPro Hub since it fits in the spare tire but still offers a very respectable 11″ woofer. Unfortunately, I didn’t measure everything before I ordered it and I found that it doesn’t not fit properly in the space where my spare tire is on my 2015 Mazda 6 Touring. Hopefully owners of this car looking into this option don’t make the same mistake I did.

Disclaimer: This post contains Amazon Affiliate links. If you purchase something from Amazon using a link I provided I will likely receive a commission for that sale. This helps support the site!

Photo of the stock Mazda radio

I have driven a 2015 Mazda 6 Touring with the non-Bose stereo since it was new and the number one complaint I have had is the stock radio. Mazda only offered this style of deck in the 2014 and 2015 model year 6 and then replaced it with a better, more capable unit in 2016. To say this deck is bad is an understatement. The only redeeming quality of this deck is that it is a double din sized unit that can be replaced at all. Even at the time of release this deck was a bit behind on technology including support for Pandora, iPod and USB sticks with music. Everything other than the CD player and FM/AM radio was very poorly implemented. iPods were already almost entirely replaced by smart phones at time of release yet it could rarely actually load music from an iPod or an iPhone running Music.app. Reading music from a USB took ages and browsing the music cumbersome, not to mention who wants to manage music on a USB stick? Pandora? I don’t know anyone who uses it. The CD player did work but showed the bare minimum information on the screen. Contrast this to my wife’s Toyota van which could often show cover art and just looked much more slick overall.

It would have been ok if the bluetooth implementation wasn’t riddled with bugs and annoyances. Starting the car and waiting for bluetooth to connect to your phone took minutes, sometimes several. Once it did connect, it would often fail to play music properly by either refusing to do anything or acting like it was playing but lacking any audio. If you were on a call when you started the car you would be presented with a crash/boot loop where the car would take over the call, crash sending the call back to your phone only to steal it away again when it started. This would loop forever until you ended the call. Once it was playing music it couldn’t tell you what track number you were on or the amount of time spent playing. The track number was something random and the timer always sat at 0:00. Moving between tracks was glacial with at least a second spent waiting for the song to change, including the title shown on the display. Overall the experience was subpar in every way.

All that said, I felt trapped into keeping the deck because it was responsible for controlling some configuration settings of the car including daytime running lights, door locking behavior and more. I had basically given up all hope of replacing it because I didn’t want to create new issues or lose steering wheel controls.

It wasn’t until 2024 that I learned there are devices that allow you to better integrate aftermarket decks with modern cars allowing you to keep your steering wheel controls and continue to access vehicle settings. I decided it was time to finally replace the stock deck. In this post I will detail what products I used to replace the stock radio in my 2015 Mazda 6 and what I learned throughout the installation process.

Continue reading

A while ago I learned about LoRa, or Long Range, protocol and some the applications of it. In short, LoRa is used on common ISM bands for sending data long distances over the air. While it sounded neat, it didn’t interest me enough to try it. More recently however I learned about Meshtastic which is an application that uses LoRa protocol to pass primarily text based information to other nodes by forming a mesh network. Meshtastic uses LoRa to pass messages between nodes and each node, depending on configured role, will continue to pass that message to up to (by default) three additional nodes within reach in an effort to get your message to the desired recipient(s). Additionally, Meshtastic can be configured to use MQTT to use as a backbone to pass messages over the local network or even the Internet.

Not to be confused with channels in radio jargon, but still similar, Meshtastic works by creating channels that you can be part of in order to interact with others using the same channel configuration. Channels are identified by name and, more importantly, by a pre-shared encryption key. Anyone with the encryption key is part of the group and can send or receive messages on that channel but a node doesn’t need the key in order to pass messages along. In this way, Meshtastic provides end-to-end secure messaging between users even of the message passes through a node that is not “part of the group.” You can create a channel and share it with a group of nodes/friends or share it with only a single other node to create a private channel. As long as there is a path between you and the target you are set. Meshtastic provides a number of additional features, almost all of the completely optional, which you can read about on the project’s documentation page at https://meshtastic.org/docs/configuration/module/.

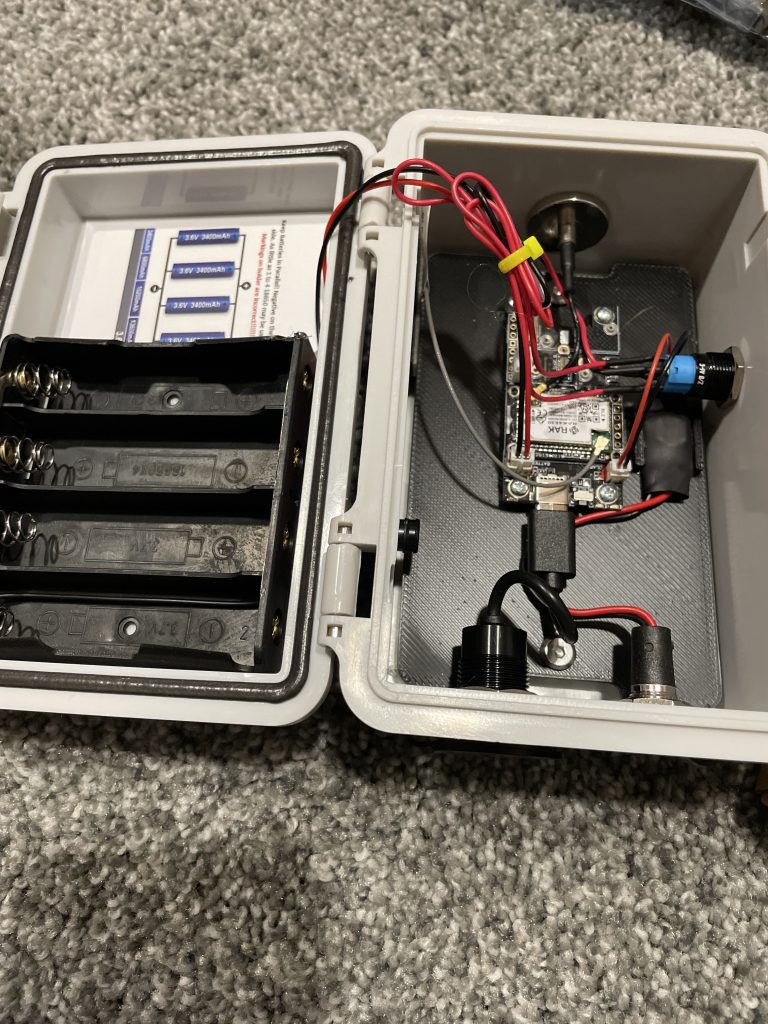
The Meshtastic documentation provides information and links to supported hardware and all hardware is equally capable of providing the core experience. To get myself started, I opted to use two Heltec V3 modules. By getting two modules I was assured that I could test the basic functionality of Meshtastic even if there are no other nodes near me. When selecting a Meshtastic module it is important that you get the correct one for your region as the ISM band that is used is different depending on where you live. Refer to https://meshtastic.org/docs/configuration/region-by-country/ to determine what frequency module you need. How you want to use the module can also determine which module you get as modules can have different features. For example, the Heltec V3 is not as energy efficient as some others so if your plan is to create a solar powered outdoor station then a RAK WisBlock might be a better fit.

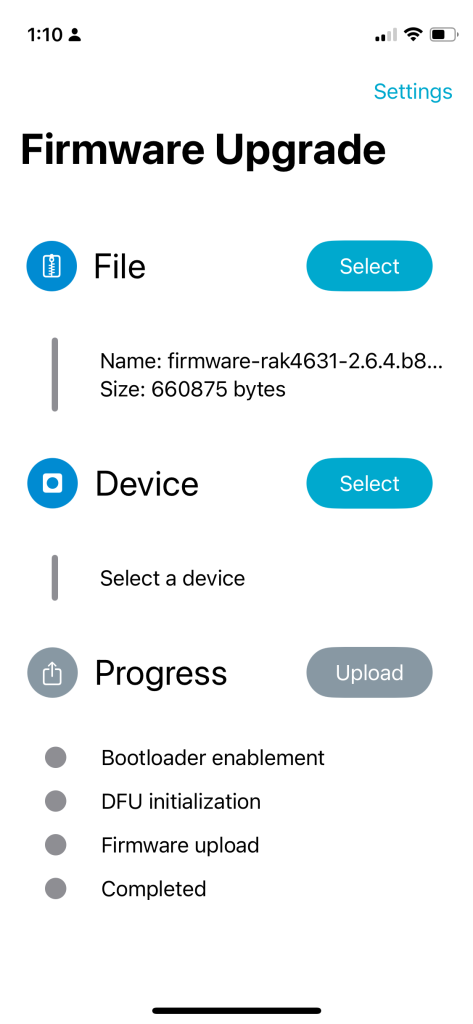
Once you have hardware you will need to flash the Meshtastic firmware to the device. The Meshtastic project has great documentation on how to do this and I recommend you follow their notes on how to do so. The documentation for flashing esp32 based hardware like the Heltec V3 can be found at https://meshtastic.org/docs/getting-started/flashing-firmware/esp32/.

After flashing the firmware you will need to perform some initial configuration. Again I recommend following the official guide on how to do this which is available at https://meshtastic.org/docs/getting-started/initial-config/. Configuring the correct settings is crucial for getting Meshtastic up and running properly and legally in your region. After the initial configuration you are immediately ready to begin communicating with other Meshtastic nodes that you have on hand or are local to you that are also using the default primary channel configuration. When starting out, you will find it is easiest to stick with the default primary channel in order to reach others with minimal fuss. You can read more about channel configuration at https://meshtastic.org/docs/configuration/radio/channels/.

Optionally, you can extend the range of your device using the internet and a tool called MQTT. This optional functionality allows your radio to leverage the internet connection of your device, or if you configure your node with a WiFi connection a direct connection, to communicate with an MQTT server. The default configuration for MQTT will use the project MQTT server and is preconfigured with the correct credentials. MQTT uses a concept known as “topics” to describe where content is posted to so that other clients can “hear” the information. By default, MQTT will use the msh/US topic which is extremely busy but is a good way to get started. You will want to configure the topic so something more local to you to lessen the noise. I will go into more detail on how to use MQTT in a future post.

For now, this is enough to get you going on Meshtastic. It can be a bit daunting and confusing at first but after some time you will get used to how it works. In future posts I will discuss channel configuration, using cli tools to configure devices and dig more deeply into using MQTT to tie areas together. In the meantime, you can find a lot of information on YouTube and I highly recommend doing a search for meshtastic there to find videos to fill in any gaps you may have.

Disclaimer: This post contains Amazon Affiliate links. If you purchase something from Amazon using a link I provided I will likely receive a commission for that sale. This helps support the site!

This post is really a small collection of thoughts about Proxmox when used in a home lab situation and home labs in general. I was originally going to post this to Mastodon only but it didn’t fit in a single post.

A lot of people (at least what I see on reddit) build Proxmox systems with shared file systems like ceph, even for home lab use. While I understand what shared file systems can do they also have steeper HW requirements and honestly the benefits are rather limited. If your purpose for using shared file systems is to learn about them, then go for it as it is a great thing to understand. Outside of learning, I prefer and have had great luck with keeping things as simple as I can while still getting something that is useful and versatile. Additionally, I also avoid the use of ZFS because running it properly requires more memory, memory I’d prefer to give to my VMs.

For that reason, my Proxmox cluster consists of two systems with a Raspberry Pi acting as a qdevice for quorum. Each system has a single spinning drive for the Proxmox OS and then a single SSD for all of the VMs that live on that node. I then have another physical system providing network based shared storage for content like ISO files and backups, things that truly need to be shared between the Proxmox cluster nodes. This setup gives me a blend of excellent VM performance because the disks are local and speedy, shared file space where it matters for ISOs and backups while maintaining one of the best features of Proxmox, live migration. Yes, live migration of VMs is still possible even when the underlying file system is not shared between systems, it’s just a lot slower of a process because data must be transferred over the network during a migration.

One of the benefits of using a file system like ceph is that you can distribute files across your systems in the event a system or disk fails. You have some redundancy there but regardless of redundancy you still need to have actual backups. To cover for this, I have regular backups taken of important VMs and separate backup tasks specifically for databases. For anything that has files, like Plex or Nextcloud, that data comes from my TrueNAS system using a network file system like NFS or Samba. Again, local storage for speed and shared storage where it really matters.

This setup gives me a lot of the benefits without a ton of overhead which helps me keep costs down. Each Proxmox node, while clustered, still work more or less independently of each other. I can recover from issues by restoring a backup to either node or recover databases quickly and easily. I don’t ever have to debug shared file system issues and any file system issues I do face are localized to the affected node. In the event of a severe issue, recovery is simplified because I can remove the replace the bad drive and simply restore any affected VMs on that node. The HA features of Proxmox are very good and I encourage their use when it makes sense, but you can avoid their complexity and maintenance and still have a reliable home lab that is easy and straight forward to live with.

For some time I’ve wanted a radio scanner so I could listen in on Police/Fire/EMS radio in my area but I’m not serious enough to pay for a dedicated-to-the-task scanner required to listen to today’s radio protocols. Today’s protocols are digitally based with trunking and patching systems that can both isolate calls to a local area while also allowing for nearby stations to be patched in. This is done with a constant control signal and a number of nearby frequencies that radios can hop to when they make a call. Decoding all of this requires specialized equipment or software that understands the P25 Phase 1 or 2 protocol. Radios that can do this start at around $250, go up from there and that’s before you get an antenna or anything associated with it. Additionally, I really like toying with Software Defined Radio (SDR) equipment and the idea of turning a computer into a scanner capable of tracking this radio system seemed fun.

In this post I am going to go through some of what I did to get setup to listen in on what I was interested in. While I knew that an SDR could be used for this task, I didn’t know how to put it together, what software was required and so on.

Get to know the radio systems used near you

The first thing I had to do was confirm what type of radio system was used near me. For that I turned to https://www.radioreference.com. Here, I learned that in the state of Minnesota, all Public Safety Agencies use ARMER which is a P25 Phase 1 system. Based on this information I knew better what to expect when it came to the hardware needed as well as what software I needed to research. Later, as I was setting up the software, I registered for a paid account with Radio Reference so that I could automatically pull down information about frequencies used and more.

Using the site, try to locate a tower site that is as close to you as possible and make note of the frequencies used. The important part to know

Get the right hardware

For the SDR itself, I went with this RTL-SDR Blog V3 brand unit (Amazon Affiliate Link) based on information I found that suggesting it was better supported. I also selected this unit because it has an SMA style connector for a screwed together, stronger connection to the antenna. Additionally I grabbed this antenna set (Amazon Affiliate Link) because it offered a range of antennas that would be a good fit for what I was doing.

Note that, depending on the frequencies used in your area, you may need more than one SDR in order to tune them all in. If your local system is P25 based it will use a main control channel and then a set of additional frequencies for callers to use. This is commonly referred to as a trunk based system. The frequencies in use near you need to fit in the range your SDR can tune in and listen to at the same time. The dongle you select should advertise the bandwidth it can tune to. For example, the SDR I selected advertises “up to 3.2 MHz of instantaneous bandwidth (2.4 MHz stable)” which means it can reliably listen to anything within a 2.4mhz range of frequencies. On a P25 system, the control frequency must always be tracked and all additional frequencies must be within 2.4mhz of the control frequency. If the frequencies used fall outside of this range then you may need multiple SDR adapters to hear everything.

The system near me uses two different control frequencies:

  • 857.2625
  • 860.2625

Callers then are on:

  • 856.2625
  • 857.0125
  • 858.2625
  • 859.2625

As long as I do not select the 860.2625 control frequency, the SDR can tune and hear any of the other frequencies in at the same time as they are all within 2.4mhz from the control frequency.

You may elect to get more than one SDR if you wish to listen to additional trunks or other frequencies at the same time. Later you will see that you can set priorities on what frequencies or trunks you want to listen to first in the event two frequencies become active.

Software

After a short bit of research I found there is a handful of software options available but I quickly settled on SDRTrunk. SDRTrunk is freely available, Java based software that will run on Windows, Mac and Linux alike. It seemed to be among the most recommended pieces of software for this task and readily available information on how to set it up. I used this YouTube video to get things setup – https://www.youtube.com/watch?v=b9Gk865-sVU. The author of the video does a great job explaining how trunking works, talk groups, how to pull in data from Radio Reference and how to configure the software for your needs.

Putting it all together

For my setup I used an older iMac running Ubuntu 22.04. I installed the SDRTrunk software per their directions and used the above mentioned video to learn how to configure the software. The system was almost ready to go out of the box but I had to install rtl-sdr from apt for the device to be recognized by the software. I used the adjustable, silver dipole antenna from the antenna kit with it fully collapsed. This was the closest I could get to the appropriately sized antenna for the frequencies used. I used this site to determine antenna length for a given frequency – https://www.omnicalculator.com/physics/dipole. I am located quite close to the broadcast tower so even a poorly sized antenna still worked. Sizing the antenna properly will assist greatly in improving your ability to tune something in. Even fully collapsing the antenna vs fully extending the antenna resulted in nearly a 10dB improvement in signal strength.

The last thing I did was setup an Icecast 2.4 based broadcast so I can tune in away from home. SDRTrunk has support for a few different pieces of streaming software and Iceast seemed to be the easiest to setup.

Finishing up

While not a full how-to, I hope my post gives you just enough information to get started. I am amazed at how well this solution, the SDR, software and more all work together so well. Better than I expected. I also like that I can repurpose the SDR for other tasks if I want, like pulling in data from remote weather stations and more. If there is something you have a question about leave a comment or find me on Mastodon.

Disclaimer: This post contains Amazon Affiliate links. If you purchase something from Amazon using a link I provided I will likely receive a commission for that sale. This helps support the site!

Some time ago I removed Google Analytics to avoid the tracking that came along with it and it all being tied to Google. I also wasn’t overly concerned about how much traffic my site got. I write here and if it helps someone then great but I’m not out here to play SEO games. Recently, however, I heard of a new self hosted option called Umami that claims to respect user privacy and is GDPR compliant. In this post I will go through how I set it up on the site.

Umami supports both PostgreSQL and MySQL. The installation resource I used, discussed below, defaults to PostgreSQL as the datastore and I opted to stick with that. PostgreSQL is definitely not a strong skill of mine and I struggled to get things running initially. Although I have PostgreSQL installed on a VM already for my Mastodon instance, I had to take some additional steps to get PostreSQL ready for Umami. After some trial and error I was able to get Umami running.

My installation of PostreSQL is done using the official postgres.org resources which you can read about at https://www.postgresql.org. In addition to having PostgreSQL itself installed as a service I also needed to install postgresql15-contrib in order to add pgcrypto support. pgcrypto support wasn’t something I found documented in the Umami setup guide but the software failed to start successfully without it and an additional step detailed below. Below is how I setup my user for Umami with all commands run as the postgres user or in psql. Some info was changed to be very generic, you should change it to suit your environment:

  • cli: createdb umami
  • psql: CREATE ROLE umami WITH LOGIN PASSWORD 'password’;
  • psql: GRANT ALL PRIVILEGES ON DATABASE umami TO umami;
  • psql: \c umami to select the umami database
  • psql: CREATE EXTENSION IF NOT EXISTS pgcrypto;
  • psql: GRANT ALL PRIVILEGES ON SCHEMA public TO umami;

With the above steps taken care of you can continue on.

Since I am a big fan of using Kubernetes whenever I can, my Umami instance is installed into my k3s based Kubernetes cluster. For the installation of Umami I elected to use a Helm chart by Christian Huth which is available at https://github.com/christianhuth/helm-charts and worked quite well for my purposes. Follow Christian’s directions for adding the helm chart repository and read up on the available options. Below is the helm values I used for installation:

ingress:
  # -- Enable ingress record generation
  enabled: true
  # -- IngressClass that will be be used to implement the Ingress
  className: "nginx"
  annotations:
    cert-manager.io/cluster-issuer: letsencrypt-production
  # -- Additional annotations for the Ingress resource
  hosts:
    - host: umami.dustinrue.com
      paths:
        - path: /
          pathType: ImplementationSpecific
  # -- An array with the tls configuration
  tls:
    - secretName: umami-tls
      hosts:
        - umami.dustinrue.com

umami:
  # -- Disables users, teams, and websites settings page.
  cloudMode: ""
  # -- Disables the login page for the application
  disableLogin: ""
  # -- hostname under which Umami will be reached
  hostname: "0.0.0.0"

postgresql:
  # -- enable PostgreSQL™ subchart from Bitnami
  enabled: false

externalDatabase:
  type: postgresql

database:
  # -- Key in the existing secret containing the database url
  databaseUrlKey: "database-url"
  # -- use an existing secret containing the database url. If none given, we will generate the database url by using the other values. The password for the database has to be set using `.Values.postgresql.auth.password`, `.Values.mysql.auth.password` or `.Values.externalDatabase.auth.password`.
  existingSecret: "umami-database-url"

The notable changes I made from the default values provided is I enabled ingress and set my hostname for it as required. I also set cloudMode and diableLogin to empty so that these items were not disabled. Of particular note, leaving hostname at the default value is the correct option as setting it to my hostname broke the startup process. Next, I disabled the postgresql option. This disables the installation of PostgreSQL as a dependent chart since I already had PostreSQL running.

The last section is how I defined my database connection information. To do this, I created a secret using kubectl create secret generic umami-database-url -n umami and then edited the secret with kubectl edit secret umami-database-url -n umami. In the secret, I added a data section with base64 encoded string for “postgresql://umami:[email protected]:5432/umami”. The secret looks like this:

apiVersion: v1
data:
  database-url: cG9zdGdyZXNxbDovL3VtYW1pOnBhc3N3b3JkQDEwLjAuMC4xOjU0MzIvdW1hbWk=
kind: Secret
metadata:
  name: umami-database-url
  namespace: umami
type: Opaque

Umami was then installed into my cluster using helm install -f umami-values.yaml -n umami umami christianhuth/umami which brought it up. After a bit of effort on the part of Umami to initialize the database I was ready to login using the default username/password of admin/umami.

I setup a new site in Umami per the official directions and grabbed some information that is required for site setup from the tracking code page.

Configuring WordPress

Configuring WordPress to send data to Umami was very simple. I added the integrate-umami plugin to my installation, activated the plugin and then went to the settings page to input the information I grabbed earlier. My settings page looks like this:

Screenshot of Umami settings showing the correct values for Script Url and Website ID. These values come from the Umami settings screen for a website.

With this information saved, the tracking code is now inserted into all pages of the site and data is sent to Umami.

Setting up Umami was a bit cumbersome for me initially but that was mostly because I am unfamiliar with PostgreSQL in general and the inline documentation for the Helm chart is not very clear. After some trial and error I was able to get my installation working and I am now able to track at least some metrics for this site. In fact, Umami allows me to share a public URL for others to use. The stats for this site is available at https://umami.dustinrue.com/share/GadqqMiFCU8cSC7U/Blog.

One of the challenges or points of friction for me using Proxmox in my home lab has been integrating Ansible with it more cleanly. The issue is I have traditionally maintained my inventory file manually which is a bit of a hassle. Part of the issue is that Proxmox doesn’t really expose a lot of metadata about the VMs you have running to things like tagging don’t actually exist. Despite that I set out to get a basic, dynamically generated inventory system that will work against my Proxmox installation to make the process at least a bit smoother.

For some time, Ansible has supported the idea of dynamic inventory. This type of inventory will query a backend to build out an inventory that is compliant with Ansible. Proxmox, having an API, has a dynamic inventory plugin available from the community. In this post I will showcase how I got started with a basic Proxmox dynamic inventory.

When I set out I had a few requirements. First, I really don’t have a naming convention of my VMs that makes any sense in DNS. Some systems have a fully qualified domain but most do not. The ones that do have fully qualified domain name wouldn’t actually be available over ssh on the IP resolved for that domain. To get around this, I wanted to be able to map the host name in Proxmox to its internal IP address. By default, the dynamic inventory plugin will set ansible_host to the name of the VM. For this I had to provide a compose entry to set the ansible_host which you’ll see below. This feature is made possible because I always install the qemu guest agent.

The second requirement is that ssh connection info was dynamic as well because I use a number of different operating systems. Since all of my systems use cloud-init I am able to set the ssh username to the ciuser value thus ensuring I always know what the ssh user is regardless of the operating system used.

Here is my dynamic inventory file:

plugin: community.general.proxmox
validate_certs: false
want_facts: true
compose:
  ansible_host: proxmox_agent_interfaces[1]["ip-addresses"][0].split('/')[0]
  ansible_user: proxmox_ciuser

I placed this information into inventory/inventory.proxmox.yaml. Most of the entries are self-explanatory but I will go through what the compose section is doing.

The first item in the compose section is setting the ansible_host. When the inventory plugin gathers information from Proxmox it will gather the assigned IP addresses as determined using the Qemu Guest Agent. In all cases that I could see, the first IP address will be localhost and the second one will always be the primary interface in the system. With information known, I was able to create the jinja2 template to grab the correct IP address and strip the netmask off of it.

The next line is setting the ansible_user by just copying the proxmox_ciuser value. With these two variables set, Ansible will use that username when connecting to the host at its internal IP address. Since the systems were brought up using cloud-init, my ssh key is already present on all of the machines and the connection works without much fuss.

To support this configuration, here is my ansible.cfg:

[defaults]
inventory = ./inventory
fact_caching_connection = .cache
retry_files_enabled = False
host_key_checking = False
forks = 5
fact_caching = jsonfile

[inventory]
cache = True
cache_plugin = jsonfile

[ssh_connection]
pipelining = True
ssh_args = -F ssh_config

This configuration is setting a few options for me related to how to find the inventory, where to cache inventory information and where to cache facts about remote machines. Caching this info greatly speeds up your Ansible runs and I recommend it. The ssh_args value allows me to specify some additional ssh connection info.

In addition to the above configuration files, there are environment variables that are set on my system. These variables define where to find the Proxmox API, what user to connect with and the password. The environment variables are defined on the dynamic inventory plugin page but here is what my variables look like:

PROXMOX_PASSWORD=[redacted]
PROXMOX_URL=https://[redacted]:8006/
PROXMOX_INVALID_CERT=True
PROXMOX_USERNAME=root@pam
PROXMOX_USER=root@pam

The user/username value is duplicated because some other tools rely on PROXMOX_USERNAME instead of PROXMOX_USER.

And that’s it! With this configured I am able to target all of my running hosts by targeting “proxmox_all_running”. For example, ansible proxmox_all_running -m ping will ping all running machines across my Proxmox cluster.

TLDR; The fix for this is to ensure you are forcing your CDN to properly handle “application/activity+json” in the Accept header vs anything else. In other words, you need to Vary on Accept, but it’s best to limit it to “application/activity+json” if you can.

With the release of ActivityPub 1.0.0 plugin for WordPress I hope we’ll see a surge in the number of WordPress sites that can be followed using your favorite ActivityPub based systems like Mastodon and others. However, if you are hosting your WordPress site on Cloudflare (and likely other CDNs) and you have activated full page caching you are going to have a difficult time integrating your blog with the greater Fediverse. This is because when an ActivityPub user on a service like Mastodon performs a search for your profile, that search will land on your WordPress author page looking for additional information in JSON format. If someone has visited your author page recently in a browser then there is the chance Mastodon will get HTML back instead resulting in a broken search. The reverse of this situation can happen too. If a Mastodon user has recently performed a search and later someone lands on your author page, they will see JSON instead of the expected results.

The cause of this is because Cloudflare doesn’t differentiate between a request looking for HTML or one looking for JSON, this information is not factored into how Cloudflare caches the page. Instead, it only sees the author page URL and determines that it is the same request and returns whatever it has. The good news is, with some effort, we can trick Cloudflare into considering what type of content the client is looking for while still allowing for full page caching. Luckily the ActivityPub has a nice undocumented feature to help work around this situation.

To fix this while keeping page caching you will need to use a Cloudflare worker to adjust the request if the Accept header contains “application/activity+json”. I assume you already have page caching in place and you do not have some other plugin on your site that would interfere with page caching, like batcache, WP SuperCache and more. For my site I use Cloudflare’s APO for WordPress and nothing else.

First, you will want to ensure that your “Caching Level” configuration is set to standard. Next, you will need to get setup for working with Cloudflare Workers. You can follow the official guide at https://developers.cloudflare.com/workers/. Next, create a new project, again using their documentation. Next, replace the index.js file contents with:

export default {
  async fetch(req) {
    const acceptHeader = req.headers.get('accept');
    const url = new URL(req.url);

    if (acceptHeader?.indexOf("application/activity+json") > -1) {
      url.searchParams.append("activitypub", "true");
    }

    return fetch(url.toString(), {
      cf: {
        // Always cache this fetch regardless of content type
        // for a max of 5 minutes before revalidating the resource
        cacheTtl: 300,
        cacheEverything: true,
      },
    });
  }
}

You can now publish this using wrangler publish. You can adjust the cacheTtl to something longer or shorter to suite your needs.

Last step is to associate the worker with the /author route of your WordPress site. For my setup I created a worker route of “*dustinrue/author*” and that was it. My site will now cache and return the correct content based on whether or not the Accept header contains “application/activity+json”.

Remember that Cloudflare Workers do cost money though I suspect a lot of small sites will easily fit into the free tier.